

What therapeutic areas have received the most funding in private drug companies over the last decade? How much of this has been for new drugs vs drug delivery? How much into biologics vs small molecules?
This week, we released a first-of-its-kind, comprehensive report on venture capital trends covering 2004-2013.
To investigate investor trends in specific therapeutic areas and level of innovation, we analyzed data from four venture capital databases to create the broadest, most comprehensive study possible – a categorization of $38 billion of venture capital into more than 1,200 U.S. drug companies, receiving more than 2,000 rounds of funding over the last 10 years (2004-2013).1
Individual tranches within each investment round were categorized by lead program at the time funding was received as to phase of development, disease and indication, modality, and, most uniquely, level of novelty. To assess level of novelty, we grouped companies into two categories: 1) novel R&D of new chemical entities with no prior regulatory approval, and 2) R&D that improves upon existing therapeutics, such as new delivery methods, new formulations, and repurposing.
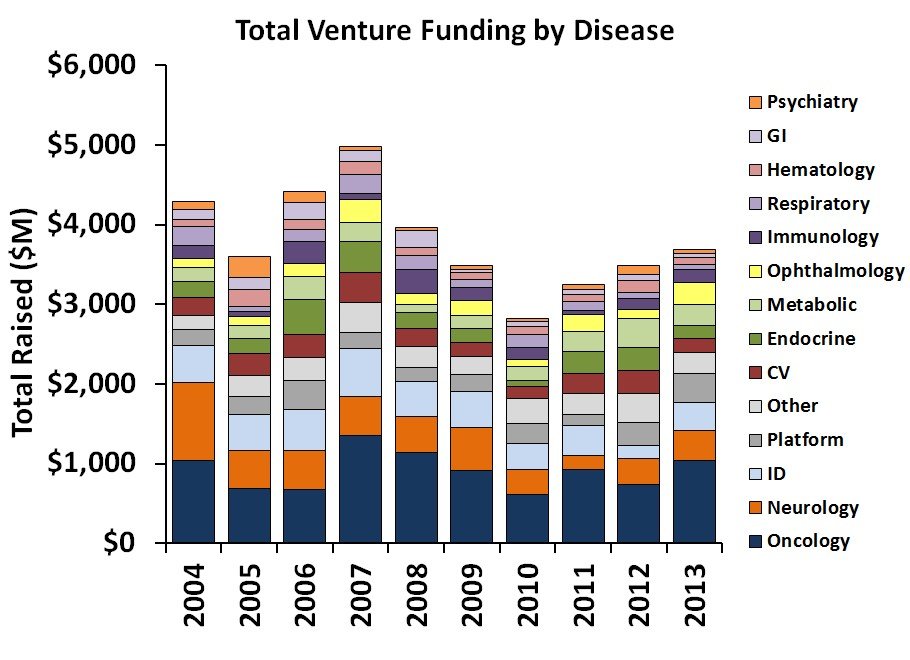
Total venture funding by disease category, 2004-2013
For disease-specific increases or decreases in financing over the time period, we compared year-over-year changes as well as five-year windows – the most recent five-year window versus the preceding five-year window. This splits the 10-year period into pre-financial crisis (2004-2008) and post-financial crisis (2009-2013).
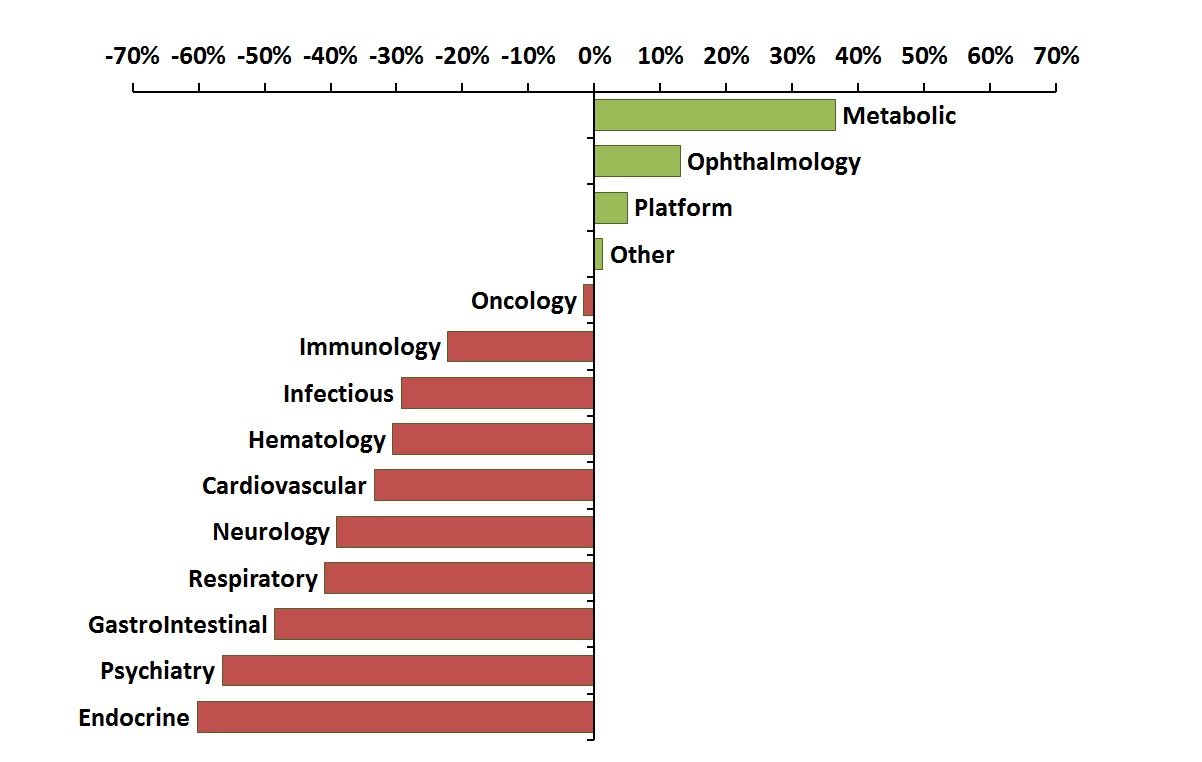
Percent change in venture funding of novel drug R&D for 2004-2008 vs 2009-2013
The chart above compares novel drug R&D funding by disease in the two prior five-year windows, 2004-2008 vs. 2009-2013. The most notable decreases are found in Endocrine (-60%), Psychiatry (-56%), Gastrointestinal (-49%), Respiratory (-41%), and Neurology (-39%). These are substantial declines that have impacted many entrepreneurs across the industry seeking additional funding for diseases effecting large populations. For many of these areas, the breakout by sub-indication (below) provides additional insight into these large decreases in investment.
For new company formation, we looked at first time Series A financings. Here we see a drop from 89 companies formed in 2006 to only 63 in 2013. While fewer drug focused biotechs are being started, there are actually more dollars for novel R&D being invested into Series A companies. This implies a much more selective process to take a company from seed stage ideas to a more meaningful syndicated bolus of funding that will progress compounds to proof of concept.
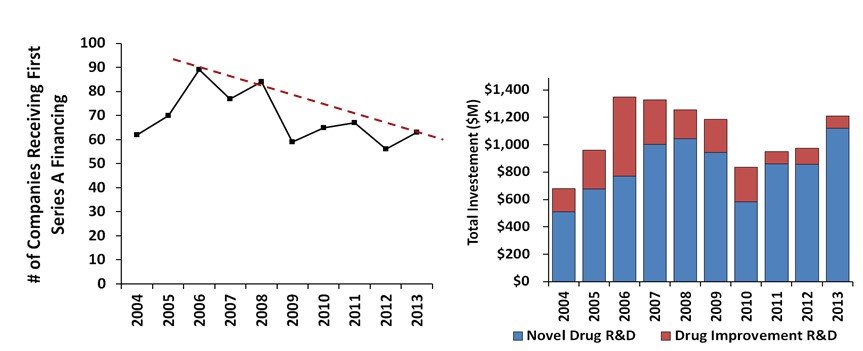
First time Series A financings and total funding by novel vs drug improvement R&D
The findings from the report will assist in discussions on scientific or policy issues that may be impacting the ability to maintain a robust pipeline of innovative medicines – a goal that is shared by patients, healthcare providers, policymakers, investors, and the biopharmaceutical industry alike.
1. Primary data sources: Thomson Reuters, Biocentury, Informa Strategic Transactions Database, EvalutePharma. Secondary data sources: sec.gov, company press releases, Xconomy, FierceBiotech, BiotechGate, Factset
Source: Biotech New
Posts relacionados


Ainda não recebemos comentários. Seja o primeiro a deixar sua opinião.
Deixe um comentário